Prometheus配置
简介
Prometheus受启发于Google的Brogmon监控系统(相似的Kubernetes是从Google的Brog系统演变而来),从2012年开始由前Google工程师在Soundcloud以开源软件的形式进行研发,并且于2015年早期对外发布早期版本。2016年5月继Kubernetes之后成为第二个正式加入CNCF基金会的项目,同年6月正式发布1.0版本。2017年底发布了基于全新存储层的2.0版本,能更好地与容器平台、云平台配合。
特点
- 易于部署:单一二进制文件,部署简单
- 高效数据模型:监控指标以时序序列保存在存储中,并可灵活设置标签来对数据不同维度进行区分;
- 强大查询语言PromQL:内置的PromQL支持查询、聚合、过滤等复杂操作,可实现高效的查询;
- 易于扩展:支持分区和联邦集群部署,并可结合thano实现分布式部署;
- 易于集成:支持多种语言SDK,拥有大量第三方集成模块,可方便与第三方系统进行集成
架构
Prometheus 的主要模块包括:Prometheus server, exporters, Pushgateway, PromQL, Alertmanager 以及图形界面。
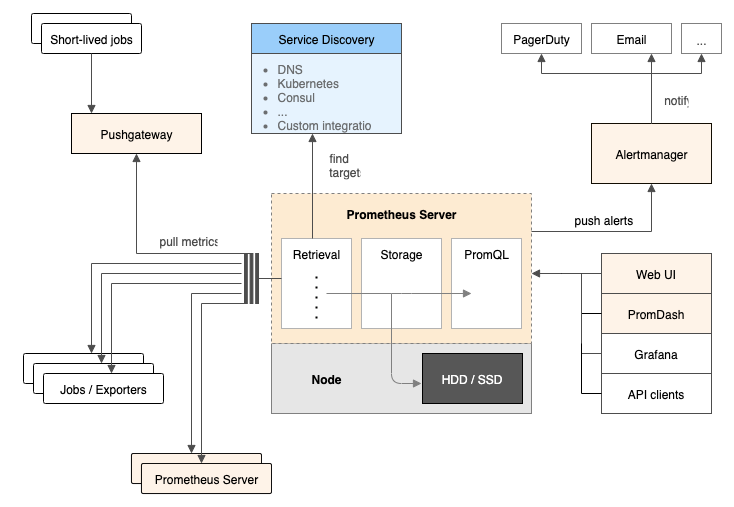
工作流程
- Prometheus server 定期从配置好的 jobs 或者 exporters 中拉 metrics,或者接收来自 Pushgateway 发过来的 metrics,或者从其他的 Prometheus server 中拉 metrics。
- Prometheus server 在本地存储收集到的 metrics,并运行已定义好的 alert.rules,记录新的时间序列或者向 Alertmanager 推送警报。
- Alertmanager 根据配置文件,对接收到的警报进行处理,发出告警。
- 在图形界面中,可视化采集数据。
数据模型
Prometheus 中存储的数据为时间序列,是由 metric 的名字和一系列的标签(键值对)唯一标识的,不同的标签则代表不同的时间序列,如:
| |
该时序的名字为 api_http_requests_total,标签为 path、status、method 和 instance,只有时序名字和标签键值完全相同的时序才是同一个时序。事实上,时序名字就是一个隐藏标签:
| |
指标类型
Prometheus的时序数据包含以下四种类型:
- Counter: 用于累计计数,例如用来记录请求次数。Counter的特点是一直增加不会减少。
- Gauge:用于记录常规数值,可以增加或减少。例如用来记录CPU、内存的变化
- Histogram:可理解为直方图,常用于跟踪事件发生的规模,如请求耗时、响应大小。可对记录的内容分组和聚合(count,sum等),例如响应时间小于500毫秒的多少次、500毫秒~1000毫秒之间多少次、1000毫秒以上的多少次
- Summary:与Histogram类似,但支持按百分比跟踪结果
存储模型
prometheus是一个时序型KV数据库,时序数据拥有垂直写,水平读的特点,在此基础上
第1代: Prototype:直接利用LevelDB作为本地持久化存储,
第2代: Prometheus V1
第3代: Prometheus V2
高可用方案
存储原理
Prometheus按2小时一个block进行存储,每个block由一个目录组成,该目录里包含:
一个或者多个chunk文件(保存timeseries数据);
一个metadata文件;
一个index文件(通过metric name和labels查找timeseries数据在chunk文件的位置)。
最新写入的数据保存在内存block中,达到2小时后写入磁盘。为了防止程序崩溃导致数据丢失,实现了WAL(write-ahead-log)机制,启动时会以写入日志(WAL)的方式来实现重播,从而恢复数据。
删除数据时,删除条目会记录在独立的tombstone文件中,而不是立即从chunk文件删除。
通过时间窗口的形式保存所有的样本数据,可以明显提高Prometheus的查询效率,当查询一段时间范围内的所有样本数据时,只需要简单的从落在该范围内的块中查询数据即可。
这些2小时的block会在后台压缩成更大的block,数据压缩合并成更高level的block文件后删除低level的block文件。这个和leveldb、rocksdb等LSM树的思路一致。
这些设计和Gorilla的设计高度相似,所以Prometheus几乎就是等于一个缓存TSDB。它本地存储的特点决定了它不能用于long-term数据存储,只能用于短期窗口的timeseries数据保存和查询,并且不具有高可用性(宕机会导致历史数据无法读取)。
内存中的block数据未写入磁盘时,block目录下面主要保存wal文件:
| |
持久化的block目录下wal文件被删除,timeseries数据保存在chunk文件里。index用于索引timeseries在wal文件里的位置。
| |
存储配置
对于本地存储,prometheus提供了一些配置项,主要包括:
- –storage.tsdb.path: 存储数据的目录,默认为data/,如果要挂外部存储,可以指定该目录
- –storage.tsdb.retention.time: 数据过期清理时间,默认保存15天
- –storage.tsdb.retention.size: 实验性质,声明数据块的最大值,不包括wal文件,如512MB
- –storage.tsdb.retention: 已被废弃,改为使用storage.tsdb.retention.time
Prometheus将所有当前使用的块保留在内存中。此外,它将最新使用的块保留在内存中,最大内存可以通过storage.local.memory-chunks标志配置。
监测当前使用的内存量:
- prometheus_local_storage_memory_chunks
- process_resident_memory_bytes
监测当前使用的存储指标:
- prometheus_local_storage_memory_series: 时间序列持有的内存当前块数量
- prometheus_local_storage_memory_chunks: 在内存中持久块的当前数量
- prometheus_local_storage_chunks_to_persist: 当前仍然需要持久化到磁盘的的内存块数量
- prometheus_local_storage_persistence_urgency_score: 紧急程度分数
内存使用
prometheus在内存里保存了最近使用的chunks,具体chunks的最大个数可以通过storage.local.memory-chunks来设定,默认值为1048576,即1048576个chunk,大小为1G。
除了采用的数据,prometheus还需要对数据进行各种运算,因此整体内存开销肯定会比配置的local.memory-chunks大小要来的大,因此官方建议要预留3倍的local.memory-chunks的内存大小。
As a rule of thumb, you should have at least three times more RAM available than needed by the memory chunks alone
可以通过server的metrics去查看prometheus_local_storage_memory_chunks以及process_resident_memory_byte两个指标值。
- prometheus_local_storage_memory_chunks
The current number of chunks in memory, excluding cloned chunks
目前内存中暴露的chunks的个数
- process_resident_memory_byte
Resident memory size in bytes
驻存在内存的数据大小
- prometheus_local_storage_persistence_urgency_score
介于0-1之间,当该值小于等于0.7时,prometheus离开rushed模式。
当大于0.8的时候,进入rushed模式
- prometheus_local_storage_rushed_mode
1表示进入了rushed mode,0表示没有。进入了rushed模式的话,prometheus会利用storage.local.series-sync-strategy以及storage.local.checkpoint-interval的配置加速chunks的持久化。
storage参数
| |
storage.local.memory-chunks
设定prometheus内存中保留的chunks的最大个数,默认为1048576,即为1G大小
storage.local.retention
用来配置采用数据存储的时间,168h0m0s即为24*7小时,即1周
storage.local.series-file-shrink-ratio
用来控制序列文件rewrite的时机,默认是在10%的chunks被移除的时候进行rewrite,如果磁盘空间够大,不想频繁rewrite,可以提升该值,比如0.3,即30%的chunks被移除的时候才触发rewrite。
storage.local.max-chunks-to-persist
该参数控制等待写入磁盘的chunks的最大个数,如果超过这个数,Prometheus会限制采样的速率,直到这个数降到指定阈值的95%。建议这个值设定为storage.local.memory-chunks的50%。Prometheus会尽力加速存储速度,以避免限流这种情况的发送。
storage.local.num-fingerprint-mutexes
当prometheus server端在进行checkpoint操作或者处理开销较大的查询的时候,采集指标的操作会有短暂的停顿,这是因为prometheus给时间序列分配的mutexes可能不够用,可以通过这个指标来增大预分配的mutexes,有时候可以设置到上万个。
storage.local.series-sync-strategy
控制写入数据之后,何时同步到磁盘,有’never', ‘always’, ‘adaptive’. 同步操作可以降低因为操作系统崩溃带来数据丢失,但是会降低写入数据的性能。
默认为adaptive的策略,即不会写完数据就立刻同步磁盘,会利用操作系统的page cache来批量同步。
storage.local.checkpoint-interval
进行checkpoint的时间间隔,即对尚未写入到磁盘的内存chunks执行checkpoint操作。
索引
一般prometheus的查询是把metric+label做关键字的,而且是很宽泛,完全用户自定义的字符,因此没办法使用常规的sql数据库,prometheus的存储层使用了全文检索中的倒排索引概念,将每个时间序列视为一个小文档。而metric和label对应的是文档中的单词。
例如,requests_total{path=”/status”, method=”GET”, instance=”10.0.0.1:80″}是包含以下单词的文档:
- name=”requests_total”
- path=”/status”
- method=”GET”
联邦(federate)集群
每一个Prometheus Server都包含一个/federate的接口,可用来获取当前节点中的监控数据。因此可通过该接口对整个prometheus集群进行拆分组合,建立分级节点,以做到集群的扩展,此模式称为联邦模式。
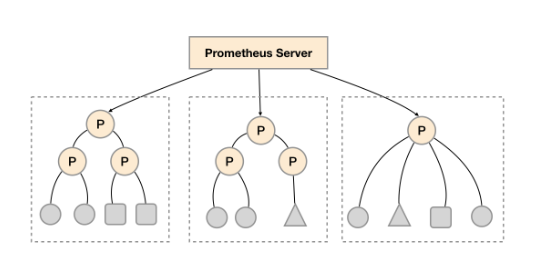
3级联邦集群
L0:
1 2 3 4 5 6 7 8 9 10 11 12 13 14 15 16 17 18 19 20 21 22 23 24 25 26 27 28 29# my global config global: scrape_interval: 1m evaluation_interval: 1m rule_files: - "/export/App/prometheus/conf/*_rules.yml" # Here it's Prometheus itself. scrape_configs: - job_name: "hbase" honor_labels: true scrape_interval: 1m scrape_timeout: 45s metrics_path: '/federate' params: 'match[]': - '{service=~".base"}' static_configs: - targets: - 11.18.132.62:9090 - 11.18.5.176:9090 - 11.17.166.111:9090 - 11.17.166.112:9090 - 11.17.198.231:9090 - 11.18.53.221:9090 - 11.17.230.96:9090 - 11.18.134.32:9090L1
1 2 3 4 5 6 7 8 9 10 11 12 13 14 15 16 17 18 19 20 21 22 23 24 25 26 27 28 29 30 31 32 33 34 35 36 37 38 39 40 41 42 43 44 45 46 47 48 49 50 51 52 53 54 55 56 57 58 59# my global config global: scrape_interval: 1m evaluation_interval: 1m rule_files: - "/export/App/prometheus/conf/*_rules.yml" # Here it's Prometheus itself. scrape_configs: - job_name: "hbase" honor_labels: true scrape_interval: 1m scrape_timeout: 45s metrics_path: '/federate' params: 'match[]': - '{service=~".base"}' relabel_configs: - source_labels: [__address__] modulus: 4 target_label: __tmp_hash action: hashmod - source_labels: [__tmp_hash] regex: ^1$ action: keep static_configs: - targets: - 11.17.95.179:9090 - 11.18.5.41:9090 - 11.18.5.42:9090 - 11.17.196.172:9090 - 11.18.37.33:9090 - 11.18.37.34:9090 - 11.18.97.88:9090 - 11.17.108.239:9090 - 11.17.108.240:9090 - 11.18.131.202:9090 - 11.17.165.240:9090 - 11.17.228.41:9090 - 11.18.163.237:9090 - 11.18.163.236:9090 - 11.17.228.40:9090 - 11.18.247.2:9090 - 11.17.130.94:9090 - 11.18.163.235:9090 - 11.18.70.175:9090 - 11.18.131.201:9090 11.18.28.106 11.18.166.71 11.18.85.93 11.18.28.107 11.17.198.232 11.18.134.35 11.17.230.97 11.17.98.43 11.18.85.92 11.18.134.34L2
1 2 3 4 5 6 7 8 9 10 11 12 13 14 15 16 17 18 19 20 21 22 23 24 25 26 27 28 29 30 31 32 33 34 35 36 37 38 39 40 41 42 43 44 45 46 47 48 49 50 51 52# my global config global: scrape_interval: 30s evaluation_interval: 30s # Alertmanager configuration #alerting: # alertmanagers: # - static_configs: # - targets: # - ALERTMANAGER_ADDR:9093 rule_files: - "/export/App/prometheus/conf/*_rules.yml" # Here it's Prometheus itself. scrape_configs: - job_name: 'consul' relabel_configs: - source_labels: ["__meta_consul_service"] action: replace regex: "(.*)" replacement: '${1}' target_label: "service" - source_labels: ["__meta_consul_tags"] action: replace regex: ',(?:[^,]+,){0}([^=]+)=([^,]+),.*' replacement: '${2}' target_label: '${1}' - source_labels: ["__meta_consul_tags"] action: replace regex: ',(?:[^,]+,){1}([^=]+)=([^,]+),.*' replacement: '${2}' target_label: '${1}' - source_labels: ["__meta_consul_tags"] action: replace regex: ',(?:[^,]+,){2}([^=]+)=([^,]+),.*' replacement: '${2}' target_label: '${1}' - source_labels: [__address__] modulus: 20 target_label: __tmp_hash action: hashmod - source_labels: [__tmp_hash] regex: ^1$ action: keep metrics_path: /metrics scheme: http consul_sd_configs: - server: 11.25.146.232:8500 services: - hbase - cbase
go_metrics
- go_memstats_alloc_bytes: Number of bytes allocated and still in use
- go_memstats_alloc_bytes_total: Total number of bytes allocated, even if freed.
- go_memstats_buck_hash_sys_bytes: Number of bytes used by the profiling bucket hash table.
- go_memstats_frees_total: Total number of frees.
- go_memstats_gc_cpu_fraction: The fraction of this program’s available CPU time used by the GC since the program started.
- go_memstats_gc_sys_bytes: Number of bytes used for garbage collection system metadata.
- go_memstats_heap_alloc_bytes: Number of heap bytes allocated and still in use.
- go_memstats_heap_idle_bytes: Number of heap bytes waiting to be used.
- go_memstats_heap_inuse_bytes: Number of heap bytes that are in use.
- go_memstats_heap_objects: Number of allocated objects.
- go_memstats_heap_released_bytes: Number of heap bytes released to OS.
- go_memstats_heap_sys_bytes: Number of heap bytes obtained from system.
- go_memstats_last_gc_time_seconds: Number of seconds since 1970 of last garbage collection.
- go_memstats_lookups_total: Total number of pointer lookups.
- go_memstats_mallocs_total: Total number of mallocs.
- go_memstats_mcache_inuse_bytes: Number of bytes in use by mcache structures.
- go_memstats_mcache_sys_bytes: Number of bytes used for mcache structures obtained from system.
- go_memstats_mspan_inuse_bytes: Number of bytes in use by mspan structures.
- go_memstats_next_gc_bytes: Number of heap bytes when next garbage collection will take place.
- go_memstats_other_sys_bytes: Number of bytes used for other system allocations.
- go_memstats_stack_inuse_bytes: Number of bytes in use by the stack allocator.
- go_memstats_stack_sys_bytes: Number of bytes obtained from system for stack allocator.
- go_memstats_sys_bytes: Number of bytes obtained from system.